The Hilbert Curve in Three Dimensions
The Hilbert curve in two dimensions is the limit of a certain sequence of paths inside a square. As the sequence progresses the path passes closer and closer to every point of the square. In the limit it passes through every point of it, and it is called a “space filling” curve. The limit path is rather academic and we will leave it to those interested in such things. Here we focus instead on the sequence of paths leading up to it.
Consider any one of the paths in the sequence. It passes through each point of a lattice of points inside the square (see the diagram below). That by itself is not remarkable. A raster scan, passing through one horizontal row of points after the other, does the same. What makes the Hilbert path interesting is that two points near one another as measured along the meandering path are on average even nearer measured “as the crow flies,” that is, along the shortest line between them in the plane. (The converse isn’t true. Some points are near one another in the plane but far from one another along the curve between them.) Whereas with the raster scan path, two points near one another measured along the path are usually the same distance measured in the plane.
The sequence of Hilbert paths is defined inductively, that is, a path is determined by the one before, as follows.
Imagine the square divided into four quadrants numbered 1 to 4 starting at the lower left. As you go from 1 to 2 to 3 to 4, only one direction (either up-down or left-right) changes at a time.| • | | 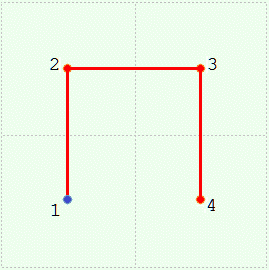 | | 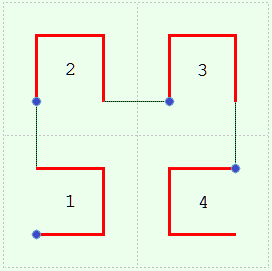 | | 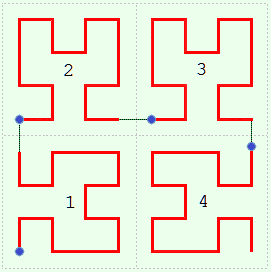 |
| Level 0 | | Level 1 | | Level 2 | | Level 3 |
Consider a sequence of such squares numbered 0, 1, 2 ... , one for each curve. Level 0 starts things off; it is merely a point in the center of the square. Now suppose we have the kth curve in the kth square. We will say the curve is at level k. We can draw the curve at level k + 1 as follows. Make four half-sized copies of level k and place them in the four quadrants of the square for level k + 1, oriented a certain way. In detail: | | Start at the lower left, quadrant 1. | Flip the copy about the ╱ diagonal. |
| | Go up, to quadrant 2. | Leave the copy as is. |
| | Go right, to quadrant 3. | Leave the copy as is. |
| | Go down, to quadrant 4. | Flip the copy about the ╲ diagonal. |
|
And as you do this connect the end of one copy to the beginning of the next. The purpose of changing the orientation is to make this connection as short as possible. These connections are always parallel to the steps in level 1.
So much for the Hilbert curve in two dimensions. We took care to describe the inductive procedure in a way that can be generalized to higher dimensions. Now we construct a similar sequence of paths in three dimensions, that is do for the cube what we just did for the square. As before we start with one point and proceed inductively.
Imagine the cube divided into eight octants numbered 1 to 8 starting at the lower left forward corner. As you step from 1 to 2 to ... to 8, only one coordinate (left-right X, forward-rearward Y, or up-down Z) changes each time.
Consider a sequence of such cubes numbered 0, 1, 2 ... , one for each curve. As we said, level 0 starts things off; a point in the center of the cube. Now suppose we have the kth curve in the kth cube. We can determine the curve in the level k + 1 cube as follows. Make eight half-sized copies of level k and place them in the eight quadrants of the cube for level k + 1, oriented to allow their easy connection. This last, finding suitable orientations, is the only difficult part. (The solution is not unique.)
We can specify the orientations by a rotation about an axis. We shall need several axes. To avoid describing them repeatedly use the following nomenclature: X means the ray
0 0 0 → 1 0 0,
that is, from the center to the right.
D
0 means the ray
0 0 0 → 1 1 1,
that is, from the center to right rear up.
D
4 means the ray
0 0 0 → –1 1 1,
that is, from the center to left rear up.
Here, then, is how to proceed from level k to level k + 1 after making eight half-sized copies of level k: |
| 0Start at octant 1. | Rotate the copy –120° about D0. |
| 0Go up, to octant 2. | Rotate the copy 120° about D0. |
| Go rearward, to octant 3. | Rotate ditto. |
| Go down, to octant 4. | Rotate the copy 180° about X. |
| Go right, to octant 5. | Rotate ditto. |
| 0Go up, to octant 6. | Rotate –120° about D4. |
| Go forward, to octant 7. | Rotate ditto. |
| 0Go down, to octant 8. | Rotate 120° about D4. |
As you do this connect the end of one copy to the beginning of the next. The purpose of the rotations is to make this connection as short as possible. These connections are always parallel to the steps in level 1.
| • | | 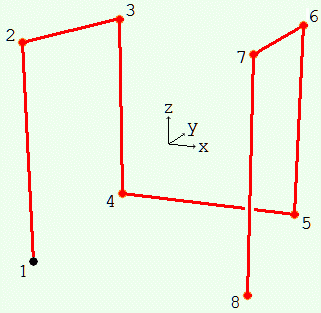 | | 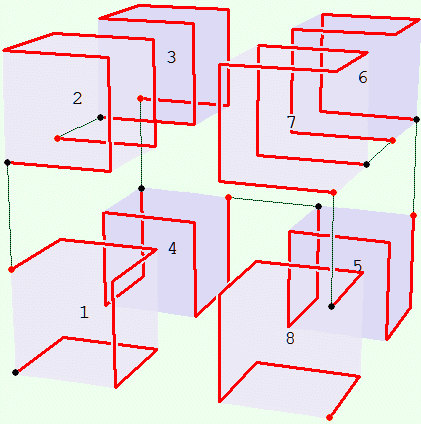 |
| Level 0 | | Level 1 | | Level 2 |
Not drawn is the enclosing cube analogous to the enclosing square drawn for the two dimensional case. At each level beyond zero the edge of that cube is a step length longer than the edge of the smallest cube the curve fits in. In other words, each of its sides is half a step length out from the apparent smallest enclosure. In the diagram for level 2 above, the shaded cubical areas are half the size of an octant of the enclosing cube the curve, in the limit as level → ∞, fills.
The parts of the following program that compute the coordinates of the curve can be used almost as is for Visual Basic, FORTRAN and any other BASIC-like compiler; the graphical display would require extra work.
This particular program does not use recursion in the programming sense, that is, a subroutine calling itself. Computing the next level requires all the points of the previous level. It proceeds “bottom up” rather than “top down.” Recursion can be used to compute the Hilbert curve in two dimensions but I don’t know about three.
Hilbert-3D.exe
'---------------------------------------------------------
' Only the subroutine PBMain is used to
' compute the 3D coordinates of the curve.
' The other subroutines help display it.
'---------------------------------------------------------

Global x(), y(), z() As Single      'dimensioned in PBMain
Global Xbuffer(), Ybuffer(), Zbuffer() As Single

Global t11, t12      As Single      'tilt matrix used by DrawMain (t13 = 0)
Global t21, t22, t23 As Single
Global t31, t32, t33 As Single

Global xtilt, ztilt As Single       'angles for tiltmatrix in radians
Global xtiltin, ztiltin As Long     'in degrees
Global radianf As Single            'conversion factor to go from degrees to radians

Global level As Long                'iteration level
Global n As Long                    'number of points of the curve in Main
Global stepsize As Single           'step size
Global pq As Single                 'pi / 4

%stepsize0 = 1000                   'initial stepsize
%maxlevel = 5                       'maximum level
'---------------------------------------------------------

'Furnishes t11, ... t33 used by DrawMain.  Depends on the angles xtilt, ztilt.
Sub GetTiltMatrix
 Local cxt, sxt As Single
 Local sr, v As Single
 Local e11, e12, e13, e21, e22, e23, e31, e32, e33 As Single

 cxt = Cos(xtilt) :sxt = Sin(xtilt)
 sr  = Sin(ztilt)

 e11 = Cos(ztilt)  :e12 = -cxt*sr          :e13 = -sxt*sr
 v = 1 - e11
 e21 = -e12        :e22 = e11 + sxt*sxt*v  :e23 = -sxt*cxt*v
 e31 = -e13        :e32 = e23              :e33 = e11 + cxt*cxt*v

 t11 =  e11
 t12 =  e12*cxt + e13*sxt
 't13 = 0, not used
 t21 =  e21
 t22 =  e22*cxt + e23*sxt
 t23 = -e22*sxt + e23*cxt
 t31 =  e31
 t32 =  e32*cxt + e33*sxt
 t33 = -e32*sxt + e33*cxt
End Sub
'---------------------------------------------------------

Sub NormalizeAngle(angle As Long)    'put angle back in the range -180 to 180
 If     angle >   180 Then
   angle = angle - 360
 ElseIf angle <= -180 Then
   angle = angle + 360
 End If
End Sub

Sub XtiltInc(ByVal delta As Long)
 xtiltin = xtiltin + delta
 NormalizeAngle xtiltin
 xtilt = xtiltin * radianf
 GetTiltMatrix
End Sub

Sub ZtiltInc(ByVal delta As Long)
 ztiltin = ztiltin + delta
 NormalizeAngle ztiltin
 ztilt = ztiltin * radianf
 GetTiltMatrix
End Sub
'---------------------------------------------------------

%viewerdistance = %stepsize0*5         'viewer distance from screen for perspective projection
%colour = %Red
%delay = 200                   'millisecond wait between drawing steps

'Display  x(i),y(i),z(i)  i = 1 to n  moved by the tilt matrix t11, t12, etc.
'Besides the tilt matrix it uses the globals: level, n.
Sub DrawMain
 Local i As Long
 Local f As Single
 Local xt, yt, zt As Single
 Local xx, yy, zz As Single
 Local s As Single

 s = 2^(level - 2)

 'first point
 xt = x(1)  :yt = y(1)  :zt = z(1)
 xx = t11*xt + t12*yt
 yy = t21*xt + t22*yt + t23*zt
 zz = t31*xt + t32*yt + t33*zt
 f = s * %viewerdistance / (%viewerdistance + yy)
 Graphic Ellipse (f*xx-5, f*zz-5) - (f*xx+6, f*zz+6), %colour, %colour
 Graphic Set Pos (f*xx, f*zz)

 'succeeding points
 For i = 2 To n
   xt = x(i)  :yt = y(i)  :zt = z(i)
   xx = t11*xt + t12*yt
   yy = t21*xt + t22*yt + t23*zt
   zz = t31*xt + t32*yt + t33*zt
   f = s * %viewerdistance / (%viewerdistance + yy)
   Sleep 1
   Graphic Line -(f*xx, f*zz), %colour
   Sleep %delay / level
   If InStat Then WaitKey$ :Exit Sub
   Graphic ReDraw
 Next
 Graphic Ellipse (f*xx-5, f*zz-5) - (f*xx+6, f*zz+6), %colour, %colour
 Graphic ReDraw
End Sub
'---------------------------------------------------------

%leftkey  = 75     'extended key codes for arrow keys
%upkey    = 72
%rightkey = 77
%downkey  = 80

' This breaks the curve up into line segments, sorts them on depth,
' then draws the furthest first so that what's in front covers what's
' in back.  Besides the tilt matrix it uses the globals: level, n.
Function DrawMainFinal As Long                 'return 1 if user presses Esc to quit
 Local i, k As Long
 Local f As Single
 Local xt, yt, zt As Single
 Local s As Single
 Dim xx1(n) As Long, zz1(n) As Long
 Dim xx2(n) As Long, zz2(n) As Long
 Dim yy(n) As Long
 Local yyA, yyB As Single
 Dim index(n) As Long
 Local x1, z1, x2, z2 As Long
 Local vx, wx, vz, wz As Single
 Local vlen As Single
 Local xdot1, zdot1, xdotn, zdotn As Single    'beginning and end dots
 Local wk As String
 Local halocolor As Long

 s = 2^(level - 2)

 Do

   For i = 1 To n                                 'for tag sort
    index(i) = i
   Next

   xt = x(1)  :yt = y(1)  :zt = z(1)
   yyA = t21*xt + t22*yt + t23*zt
   f = s * %viewerdistance / (%viewerdistance + yyA)
   xdot1 = f * (t11*xt + t12*yt)           :xx1(1) = xdot1
   zdot1 = f * (t31*xt + t32*yt + t33*zt)  :zz1(1) = zdot1

   For i = 1 To n - 1
     xt = x(i)  :yt = y(i)  :zt = z(i)
     yyB = t21*xt + t22*yt + t23*zt
     f = s * %viewerdistance / (%viewerdistance + yyB)
     xx2(i) = f * (t11*xt + t12*yt)
     zz2(i) = f * (t31*xt + t32*yt + t33*zt)
     xx1(i+1) = xx2(i)
     zz1(i+1) = zz2(i)
     yy(i) = yyA + yyB
     yyB = yyA
     If InStat Then
      wk = WaitKey$
      If wk = $Cr Or wk = $Esc Then Exit For
     End If
   Next
   xt = x(i)  :yt = y(i)  :zt = z(i)              'here i = n
   yyB = t21*xt + t22*yt + t23*zt
   yy(i) = yyA + yyB
   f = s * %viewerdistance / (%viewerdistance + yyB)
   xdotn = f * (t11*xt + t12*yt)           :xx2(i) = xdotn
   zdotn = f * (t31*xt + t32*yt + t33*zt)  :zz2(i) = zdotn

   Array Sort yy(1), TagArray index(), Descend    'sort back to front

   halocolor = RGB(212,208,200)                   'window background color

   For i = 1 To n
     k = index(i)

     x1 = xx1(k)  :z1 = zz1(k)
     x2 = xx2(k)  :z2 = zz2(k)

     wx = x1 - x2  :wz = z1 - z2                  'backlight
     vlen = Sqr(wx*wx + wz*wz)
     If vlen Then
       vx = -wz*3/vlen                            'perpendicular to line
       vz =  wx*3/vlen
       wx = -vz*2.35                              'along line
       wz =  vx*2.35
       Graphic Line(x1+vx+wx,z1+vz+wz)-(x2+vx-wx,z2+vz-wz),halocolor
       Graphic Line(x1-vx+wx,z1-vz+wz)-(x2-vx-wx,z2-vz-wz),halocolor

     End If

     Graphic Line (x1, z1)-(x2, z2), %colour
   Next

   Graphic Ellipse (xdot1-5, zdot1-5) - (xdot1+6, zdot1+6), %colour, %colour
   Graphic Ellipse (xdotn-5, zdotn-5) - (xdotn+6, zdotn+6), %colour, %colour
   Graphic ReDraw

   Do                                                  'wait for user to press a key
     wk = WaitKey$
     Input Flush
     If     Len(wk) = 1 Then
       If wk = $Cr Then Exit Function                  'Enter: continue on to next level
       If wk = $Esc Then Function = 1 :Exit Function   'Esc:   quit program
     ElseIf Len(wk) = 2 Then
       Select Case Asc(wk,2)
       Case %leftkey  :ZtiltInc -5                     'arrow key: change view of the current level
       Case %upkey    :XtiltInc -5
       Case %rightkey :ZtiltInc  5
       Case %downkey  :XtiltInc  5
       Case Else      :Iterate Do
       End Select
       Graphic Clear
       Exit Do
     End If
   Loop

 Loop

End Function
'---------------------------------------------------------

%ds = 750                          'graphic window size
$vert = Chr$(179) :$hori = Chr$(196)
$UL = Chr$(218) :$UR = Chr$(191)
$LL = Chr$(192) :$LR = Chr$(217)
$US = Chr$(194) :$LS = Chr$(193)

Function PBMain
 Local winC As Dword               'window handle
 Local i, j As Long                'index of point in Buffer, in Main
 Local nmax As Long                'number of points of last level
 Local lastlevel As Long           'last iteration level
 Local xx, yy, zz As Long          'a point in Buffer

 Cursor Off

 Graphic Window "Hilbert Curve in 3D",  5,0,  %ds,%ds To winC
 Graphic Attach winC,0, ReDraw
 Graphic Width 3             'draw thick lines
 Console Set Loc %ds,200     'move console out of the way
 Console Set Focus           'give console the focus so it gets user's keystrokes

 Graphic Scale (-%ds,%ds)-(%ds,-%ds)    'origin at center, z increases upwards

 pq      = Atn(1)            'pi / 4 radians or 45 degrees
 radianf = pq/45             'factor to convert from degrees to radians
 ' 3D coordinate system
 '     z up
 '     |   y away
 '     |  /
 '     | /
 '     |/______x to right

 xtiltin = 30  :ztiltin = -30              'initial tilt for display
 xtilt = xtiltin*radianf  :ztilt = ztiltin*radianf
 GetTiltMatrix

 ' There are two cubical regions:  "Main" where the
 ' curve is drawn for viewing, and "Buffer" which
 ' contains a half-sized copy of the curve in Main.

 ' We will use a "bottom up" approach and determine
 ' a level from the previous one.

 ' Assume we have the curve in Main at one level.
 ' Move it to Buffer, quarter-sized, and clear Main.
 ' Bisect Main three ways into eight smaller cubes
 ' ordered as follows (each corner in the diagram
 ' is the center of one of the small cubes):
 '
 '         3           6              positions:
 '        /|          /|              (1)   -1 -1 -1
 '       / |         / |              (2)   -1,-1, 1
 '      /  |        /  |              (3)   -1, 1, 1
 '   2 |   |     7 |   |              (4)   -1, 1,-1
 '     |   |       |   |              (5)    1, 1,-1
 '     |   |_______|___|              (6)    1, 1, 1
 '     |  4        |   5              (7)    1,-1, 1
 '     |           |                  (8)    1,-1,-1
 '   1 o         8 o
 '   Begin        End
 '
 ' Copy the contents of Buffer to each of the eight
 ' cubes of Main, oriented various ways, connecting
 ' the end of one copy to the beginning the next.
 '
 ' The copies, 1 through 8, are oriented by rotating
 ' a copy of Buffer about its center.  Numbering the
 ' cubes in order, the rotations are:
 '  (1) rotate about ( 1, 1, 1) by -120 degrees
 '  (2) rotate about ( 1, 1, 1) by +120 degrees
 '  (3) ditto
 '  (4) rotate about ( 1, 0, 0) by  180 degrees
 '  (5) ditto
 '  (6) rotate about (-1, 1, 1) by -120 degrees
 '  (7) ditto
 '  (8) rotate about (-1, 1, 1) by +120 degrees
 ' All these rotations just permute the coordinates.

 ' Start Main at the zero'th level, an isolated point.
 level = 0
 n = 1                              'number of points
 Dim x(1), y(1), z(1)
 x(1) = 0 :y(1) = 0 :z(1) = 0       'center of Main
 stepsize = %stepsize0

 Locate 2,2  :Print "If this small window has the focus then these keys will work:"
 Locate 4,2  :Print $UL;String$(36,$hori);$US+String$(25,$hori);$US;String$(13,$hori);$UR
 Locate  ,2  :Print $vert;"                                    ";$vert;"                         ";$vert;"             ";$vert
 Locate  ,2  :Print $vert;" Enter - quick finish or next level ";$vert;" Arrow key - change view ";$vert;" Esc - quit  ";$vert
 Locate  ,2  :Print $vert;"                                    ";$vert;"                         ";$vert;"             ";$vert
 Locate  ,2  :Print $LL;String$(36,$hori);$LS+String$(25,$hori);$LS;String$(13,$hori);$LR
 Locate 10,2 :Print "Drawing level:  O   (" + Format$(%maxlevel) + " maximum)";
 Locate 24,28 :Print " Algorithms.ARIwatch.com";

 Do

   If DrawMainFinal Then Exit Do    'draw line segments back to front with backlighting

   Incr level :If level > %maxlevel Then Exit Do
   Locate 10,17 :Print level;

   nmax = n*8                       ' = 8^level, the number of points, one less than number of steps
   ReDim Preserve x(nmax), y(nmax), z(nmax)                     'curve points in Main, global
   ReDim Preserve Xbuffer(nmax), Ybuffer(nmax), Zbuffer(nmax)

   Graphic Clear
   stepsize = stepsize / 2

   ' Copy the Main curve to Buffer, shrunken.  The factor
   ' is 1/4 instead of 1/2 to put space between the cubes.
   ' To better see how the copies are connected together,
   ' divide by a number greater than 4, say 6.
   For i = 1 To n
     Xbuffer(i) = x(i) / 4  :Ybuffer(i) = y(i) / 4  :Zbuffer(i) = z(i) / 4
   Next

   ' Fill Main with eight copies of Buffer, rotated per above,
   ' each beginning where the last ended.
   '
   ' For each point in the Buffer cube (index i),
   ' rotate it, apply the translation,
   ' then set the Main point (index j) to it.

   j = 1                                       'each For: same i's, new j's
   For i = 1 To n              'cube (1)
     x(j) = Ybuffer(i) - stepsize              'rotate -120° about (1, 1, 1)
     y(j) = Zbuffer(i) - stepsize              'and translate (-1,-1,-1) * stepsize
     z(j) = Xbuffer(i) - stepsize
     Incr j
   Next
   For i = 1 To n              'cube (2)
     x(j) = Zbuffer(i) - stepsize              'rotate 120° about (1, 1, 1)
     y(j) = Xbuffer(i) - stepsize              'and translate (-1,-1, 1) * stepsize
     z(j) = Ybuffer(i) + stepsize
     Incr j
   Next
   For i = 1 To n              'cube (3)
     x(j) = Zbuffer(i) - stepsize              'rotate same way as last time
     y(j) = Xbuffer(i) + stepsize              'and translate (-1, 1, 1) * stepsize
     z(j) = Ybuffer(i) + stepsize
     Incr j
   Next
   For i = 1 To n              'cube (4)
     x(j) =  Xbuffer(i) - stepsize             'rotate 180° about (1, 0, 0)
     y(j) = -Ybuffer(i) + stepsize             'and translate (-1, 1,-1) * stepsize
     z(j) = -Zbuffer(i) - stepsize
     Incr j
   Next
   For i = 1 To n              'cube (5)
     x(j) =  Xbuffer(i) + stepsize             'rotate same way as last time
     y(j) = -Ybuffer(i) + stepsize             'and translate ( 1, 1,-1) * stepsize
     z(j) = -Zbuffer(i) - stepsize
     Incr j
   Next
   For i = 1 To n              'cube (6)
     x(j) = -Zbuffer(i) + stepsize             'rotate -120° about (-1, 1, 1)
     y(j) = -Xbuffer(i) + stepsize             'and translate ( 1, 1, 1) * stepsize
     z(j) =  Ybuffer(i) + stepsize
     Incr j
   Next
   For i = 1 To n              'cube (7)
     x(j) = -Zbuffer(i) + stepsize             'rotate same way
     y(j) = -Xbuffer(i) - stepsize             'and translate ( 1, -1, 1) * stepsize
     z(j) =  Ybuffer(i) + stepsize
     Incr j
   Next
   For i = 1 To n              'cube (8)
     x(j) = -Ybuffer(i) + stepsize             'rotate 120° about (-1, 1, 1)
     y(j) =  Zbuffer(i) - stepsize             'and translate ( 1,-1,-1) * stepsize
     z(j) = -Xbuffer(i) - stepsize
     Incr j
   Next

   n = j - 1          'n = n*8 = 8^level

   DrawMain           'draw from point to point in order
   Graphic Clear      'only to clear missed points caused by flaky graphic cards
 Loop                 'DrawMainFinal will be executed at start of the next do cycle
End Function


