| << Links | Use Ctrl + or – to enlarge or reduce text size. |
A paper [“Republican Primary Election 2012 Results: Amazing Statistical Anomalies”] published by Francois Choquette (Aerospace Engineer, Statistics, California) and James Johnson (Senior Quantitative Financial Analyst, California) outlined anomalies found throughout the United States in the Republican Presidential Primary that always favored Mitt Romney. The favoritism correlated strongly with precinct size, and did not correlate with any other logical choices (such as population density, income levels, race, etc). The paper asked readers to confirm their analysis and report on findings.
I analyzed the 2012 Presidential Preference Primary in Pima County and confirmed their analysis. I also analyzed two 2012 Board of Supervisors Republican primaries and found no apparent anomalies. I analyzed many 2010 races and found anomalies in all statewide races, always apparently favoring Republicans (except for propositions). I found no anomalies in the LD28 State Senate race.
The correlation of Republican (or in the case of the Republican Presidential Primary, with Mitt Romney) strongly suggests vote count fraud, which would occur in larger precincts because it is easier to hide it there.
Pima County has persistently refused my requests to sort early ballots before doing the state-required hand-count audit because they say it is too much trouble. These statistics suggest another reason: they may be hiding vote-counting fraud.
We need to re-examine early ballots for the 2010 election, if they are still available, to confirm the hypothesis of vote-count fraud or to certify that there was none. This would involve removing the ballots from the vault under a court order, sorting them by precinct, and then hand counting some of the larger precincts. It appears from the data that we might discover vote-count fraud in every state-wide race in that election.
We need to re-examine the Republican Presidential primary early ballots in the same way, sorting them by precinct and then hand counting some of the larger precincts.
If the contention of vote-counting fraud is correct, we could be victimized by vote-continuing fraud in the November election, affecting not just the Presidential race but also state-wide races and possibly county-wide races. Anomalies in the 2010 general election appeared to show about ten percentage points taken from the Democratic candidate and added to the Republican candidate’s total. This changes the outcome of any race that is closer than 20 percentage points.
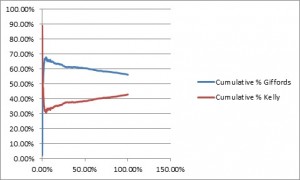
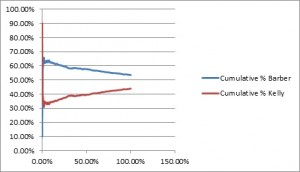
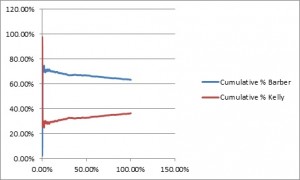
Here are some charts showing apparent vote flipping and others confirming no fraud in a race. Each chart shows a different race. Lines that move up from left to right represent votes added through fraud. Lines that move down from left to right represent votes taken away from a victim through fraud.


(Note: I have been advised by the author of the report I was following that I need to account for relative party registration numbers in this chart, which might lessen the steepness of the slopes if Democrats tend to be found in larger numbers in smaller precincts and Republicans in larger numbers in larger precincts. I am working on getting precinct-level voter registration data for 2010 so that I can recalculate this chart to more accurately reflect the anomaly.)

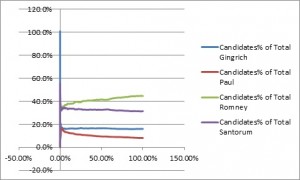
The following chart represents the 2012 Republican Presidential Preference Primary. It shows a slope upward for Mitt Romney and downward for Rick Santorum. Although there is always the possibility that these slopes could be explained by something such as moderate Republicans being found in larger numbers in large precincts and conservative Republicans being found in larger numbers in smaller precincts, it has not yet been possible to correlate the vote count data with a convincing and numerically precise explanation. This argues for sorting early ballots by precinct so that a proper hand count audit can be done. Then whatever anomalies are found in statistical analyses, we can confirm with statistically comforting precision that no fraud occurred in any election contest.


We can see that voter registration variations between the two parties in larger precincts accounts for some of the variation seen in the first chart, but we are still left with an unexplained shift of about six percent of the vote from Barber to Kelly when we compare small precincts with large precincts. What causes this shift? We simply don’t know. Could there be another demographic cause that we have not yet analyzed? Yes, but what would it be? We are left with the question to be answered: Could this shift have been caused by fraud in the computer? The answer to that is that it could have been, and without a proper hand count audit, we cannot rule out that possibility.